$41,384 is the Average Cost for 3D Visualization for Civil Engineering Projects (At Least from Our Data)
BACKGROUND
After over 6 years of providing 3D visualization services for transportation and other civil engineering projects, I sold Civil FX to Parametrix in the summer of 2020. (Side note- The Civil FX team still provides industry leading visualization for infrastructure projects- especially interactive visualization- and I highly recommend reaching out to them if you need visuals for your project or proposal. Also, all costs in USD)
In the process of understanding the value of visualization and how to price the better 3D visualization tools currently under development, I took the opportunity to pour through the numbers from the years of running Civil FX to see what the data says about the cost of these services. I generated reports on 60 projects covering over 33,000 hours of billable work over the 3+ years we used a time tracking tool (we used spreadsheets previous to that) and went away crunching the data.
While we always tried to be competitive in our estimates and fees, we were deliberately local and based in the United States. In the last few years the team met daily at an office and we tried to be available to our clients for in-person meetings. We were additionally trying to innovate and offer the best in quality and interactivity for the most effective visualization on the projects we were fortunate enough to work on. I offer this as a point of reference that while we were likely not the most costly option, we also weren’t the cheapest either. And while most of our projects were medium to very small, most of our hours were on (very large) major infrastructure system to system interchange projects with total project budgets in excess of $1 Billion USD. If you were to compare these numbers to those of an offshore and/or remote team (which we didn’t use) or a team with architectural renderings in their portfolio (which we had none of in this dataset) you’d likely see stark differences. We were proudly and deliberately US based as well as infrastructure and interactive visualization focused and our numbers may be higher than other visualization firms because of this. We tended to spend most of our hours on major interactive projects while the highest number of our projects were small or very small. These edges of the normal curve normalized the data though it is difficult to understand how much.
Just a few more notes before I share the findings of my analysis:
I added a few significant projects from before we started using this time tracking software for which I had good data.
I threw out some projects that were almost finished when we started tracking our time in this data or that weren’t yet finished when I sold Civil FX as they didn’t represent complete projects.
Most of our very large, large and some of the other projects had multiple amendments/project numbers that we billed against. I aggregated this data so that a revision amendment wouldn’t count as a complete project since we were revising previous models and data. For example, if we built an existing model with one budget but later received funding and a budget to do the proposed design, I combined these into the single project.
This is a mix of lump-sum and time and material contracts but that method of billing clients shouldn’t affect these final numbers as much as they affected our average billing rates which isn’t included here.
ANALYSIS
I separated each project into one of five categories (very large, large, medium, small and very small) in an effort to assess various project size segments of the data. The results follow:
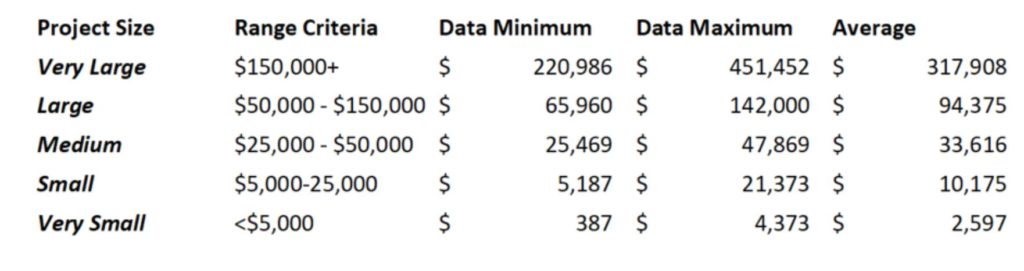
Average cost of 3D visualization for all projects- $41,384
Roughly speaking, the categories are separated in a way that the projects therein tend to be similar to each other. If there were a typical project for each category it would go something like:
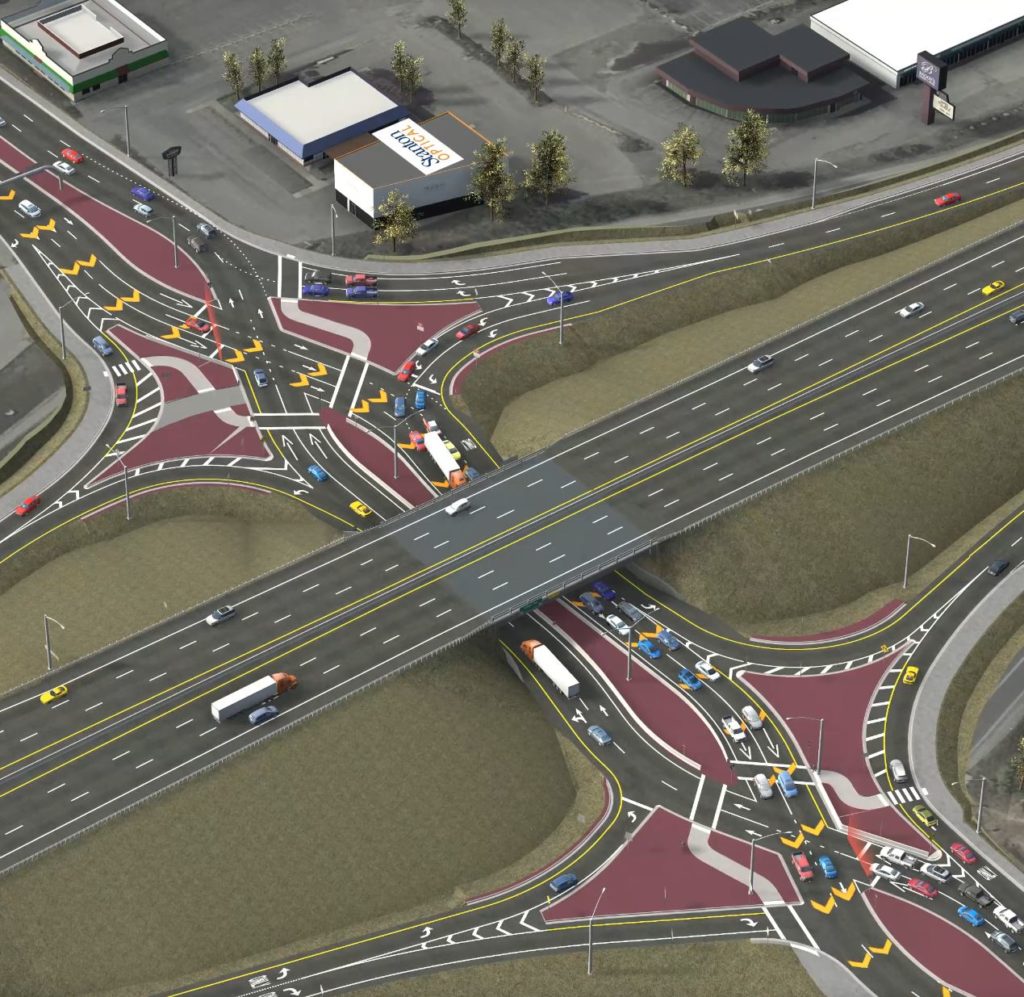
Very Large – Interactive Model of a Major Transportation Project
Large – Interactive Model of a Large Transportation Project
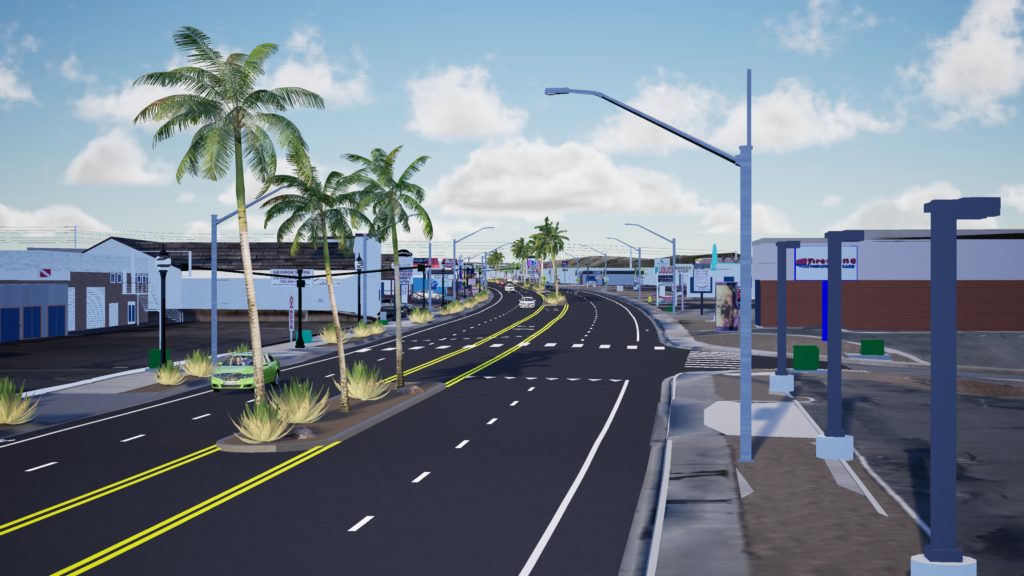
Medium – Interactive Model of a Infrastructure Project or Animated Flythrough of Longer Corridor
Small – Proposal Animation for Contractor, Small Interactive Model or Batch of Realistic Photo Composited Renders
Very Small – Very Limited Animation or Single Composited Render or Typical Section
The project size categories are, admittedly, arbitrary and drawing different range criteria would give different results. But other than the all-project total, line drawing to generate size categories needs to be done at some level and can ultimately be helpful. It is difficult to compare a photo composited render or 3D typical section that might take a day or two against a decades long, billion dollar system to system interchange interactive model that takes thousands of hours to develop. Additionally, this effort in simplifying data enough to draw conclusions does little to recognize a host of complicating factors or services we offered such as level of detail, simulated traffic data, pedestrians, detailed landscaping, video editing and voiceover, revisions and public meeting support.
That said, this information can be very useful. Depending on the reader, a 40k+ visualization cost maybe be unreasonably high or a drop in the proverbial bucket. Visualization is truly and investment and we found time and again that it was an investment that our clients attempted to use again and again whenever possible. Another takeaway from the data is that, for 3D visualization services, there may be a service offering that fits the project budget. Most civil projects can afford the $2,597 average of the very small projects, even if they are doing some realistic photo composited renders. Even the ‘very large’ projects are becoming more common as project managers see the value in interactive visualization and prepare for these costs in their budget.
We are rapidly working to build and launch a software tool that will hopefully make 3D visualization much easier for engineers to develop their own visuals using 3D models from CAD data. As we are preparing toward a launch this year, finding the right price to charge our users that will be fair to them but also account for the investment, development and ongoing support costs isn’t an easy or a perfect science. The cost of the software also won’t factor in the effort involved in whoever is using it to develop the visualization (nor the opportunity cost by said engineer/designer not working on other billable work). Pricing software is not an easy venture but now I can say with confidence that for a few hundred dollars per month, any user can purchase and use our software and not only have more control over visualization along with the ability to visualize more projects, but I can also say that the costs of the software we will be selling will be dwarfed by what it would cost to hire out similar services.
For example, if our software costs around $200/month and it takes a user half of their hours for two months to visualize an ‘average’ project, we can estimate the savings (again, we can’t factor everything in like opportunity costs). If an entry level CAD designer is making $30/hour at a 3x multiple for $90/hour and it takes them 150 hours that’s $13,500 in billable costs and $400 in software costs for a total of $13,900. This is about 1/3 of what an average project would costs to visualize.
And that’s just for one project!
Simplification and generalizations aside, the takeaway is that better visualization tools will hopefully make visualization much easier and affordable to accomplish either in-house or even by visualization teams using the better tools.
CONCLUSION
When I first fell in love with visualization 10 years ago, I used some emerging software to make some crude renderings that were good enough that the project managers I was working with were thrilled to have them. One of them even ended up on the news. This rendering was so archaic that it had no surrounding city, no traffic (animated or otherwise) and the striping was all the wrong dimensions. Still, one of these project managers proudly declared that I had saved him a large sum of money with my render that had only taken a few days to generate by not hiring out the 3D visualization like they had done previous. I’ll never forget the number he said because it was the amount of money I was making in a single year. Not understanding the complexities of good visualization and the team it would require to develop at the time, this was a wake up moment for me. If I could make something in a few days that was worth what I was making in an entire year with my salary, couldn’t a business make a profit providing 3D visualization services for this industry? This moment had such an effect on me that I then decided that I would someday start a 3D visualization firm to serve the civil engineering world and 3 years later I left full time work in the engineering field to start just that business.
Oh, and that number he mentioned? The dollar amount that he mentioned it used to cost him to have renderings made and was also what I was making per year with my salary? I hadn’t thought about it for a while until I saw the all-project average from this data analysis- forty thousand dollars.
-Sam Lytle
Founder of Beyond CAD Inc. and creator of Beyond Typicals